...to Geog 353 Main Page and Course Description
...to Geog 353 Syllabus
...to Geog 353 Course Schedule and Lecture Outlines
...to Geog 353 Laboratory Information and Student Projects
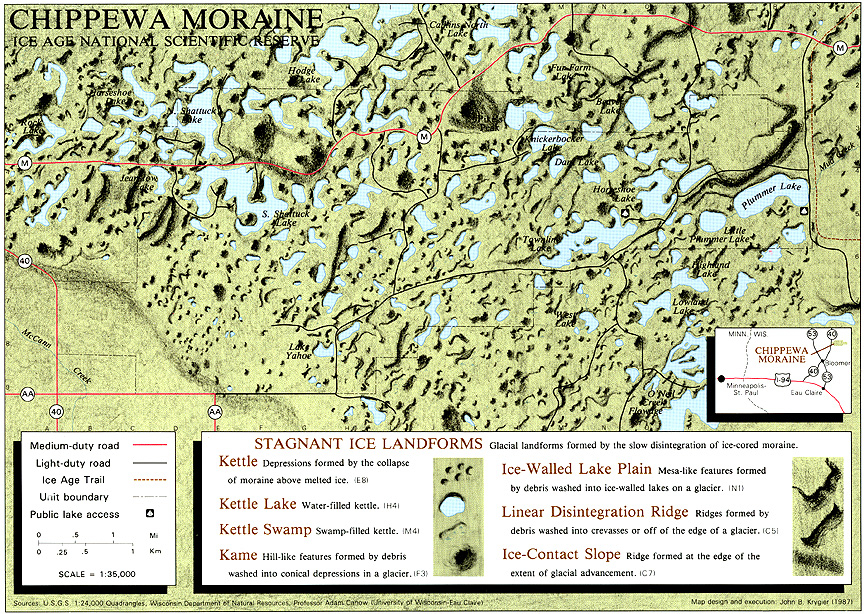
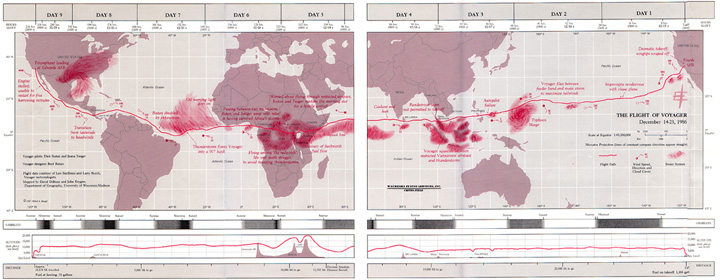
I. Traditional Cartographic Design & Map Production
II. Post-1980 Developments in Cartography and "Visualization"
Course Project: Visualizing Population Change, 1900 to 2010+
Goal: to produce a series of animated, interactive maps, for display on the WWW, which serve as a means of visualizing county level population change over time.
1. Define the Geographic Context and Mapping Method
2. Locating, Downloading, and Processing Course Data
3. Mapping the Data
4. Animating the Series of Maps
5. Placing your materials on the Web
III. Some Final Comments...


E-mail: jbkrygier@owu.edu
...to Geog 353 Main Page and Course Description
...to krygier teaching page.
...to krygier top page.