Geography 222 The Power of Maps
...to Geog 222 Main Page and Course Description
...to Geog 222 Syllabus
...to Geog 222 Course Schedule and Lecture Outlines
...to Geog 222 Laboratory Information and Student Projects
Geog 222 Lecture Outline: Map Abstraction
Update: 10/21/18
Map Abstraction
- "the process of transforming geographic data,
which represents the actual human and physical environment, into a map"
- given: data which represents some aspect of our world...
- several vital steps in transforming geographic data into a map
- 1. Map Content: given the infinite detail in the physical and human environment,
what is selected to be mapped?
- 2. Map Scale: "the extent of size reduction from the environment to the map; the
ratio of map distance to ground distance"
- 3. Map Generalization: the systematic process of removing detail from (and
sometimes adding detail to) the objects and phenomena to be mapped
- 4. Map Symbolization: the systematic process of creating graphic marks which
represent the objects and phenomena to be mapped
1. Map Content: given the infinite detail in the physical and human environment,
what is selected to be mapped?
Two basic types of cartographic maps: reference vs thematic
Further distinctions: variations in map content...where, when, and what
- Where?: spatial component: what is the area shown?
- When?: temporal: what time is the map?
- What?: selecting what to map
What gets selected to get mapped is a function of the purpose of the map
and the available data.
- PDF) Review Making Maps ch 2
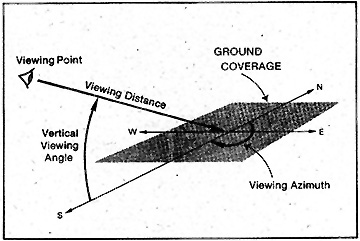
Map Vantage Point, Vertical Viewing Angle, and Perspective
Vantage point: the position that the map maker takes with respect to the earth's surface
- Viewing azimuth: horizontal viewing angle: the orientation of the map
- The world upside down (Australian world view)
- Google Earth: can reorient the virtual globe
Vertical viewing angle: view from above (plan) or the side (oblique)
- plan view: view from above
- oblique view: view from the side
- on projected maps: above and ArcView example
- on un-protected maps: Google Earth: oblique views of virtual globe
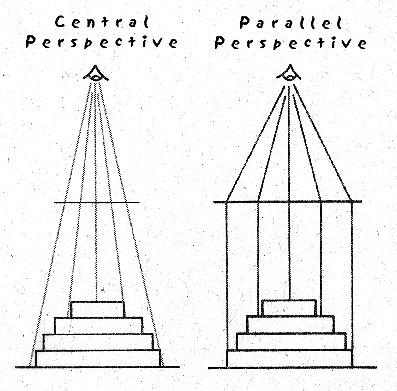
Perspective: how we see (rather than from where)
- Central perspective: one, central viewing location looking down
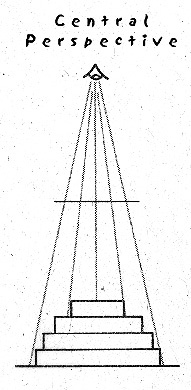
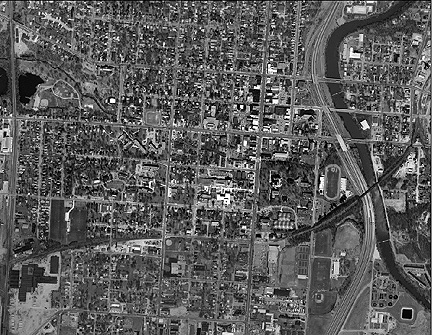
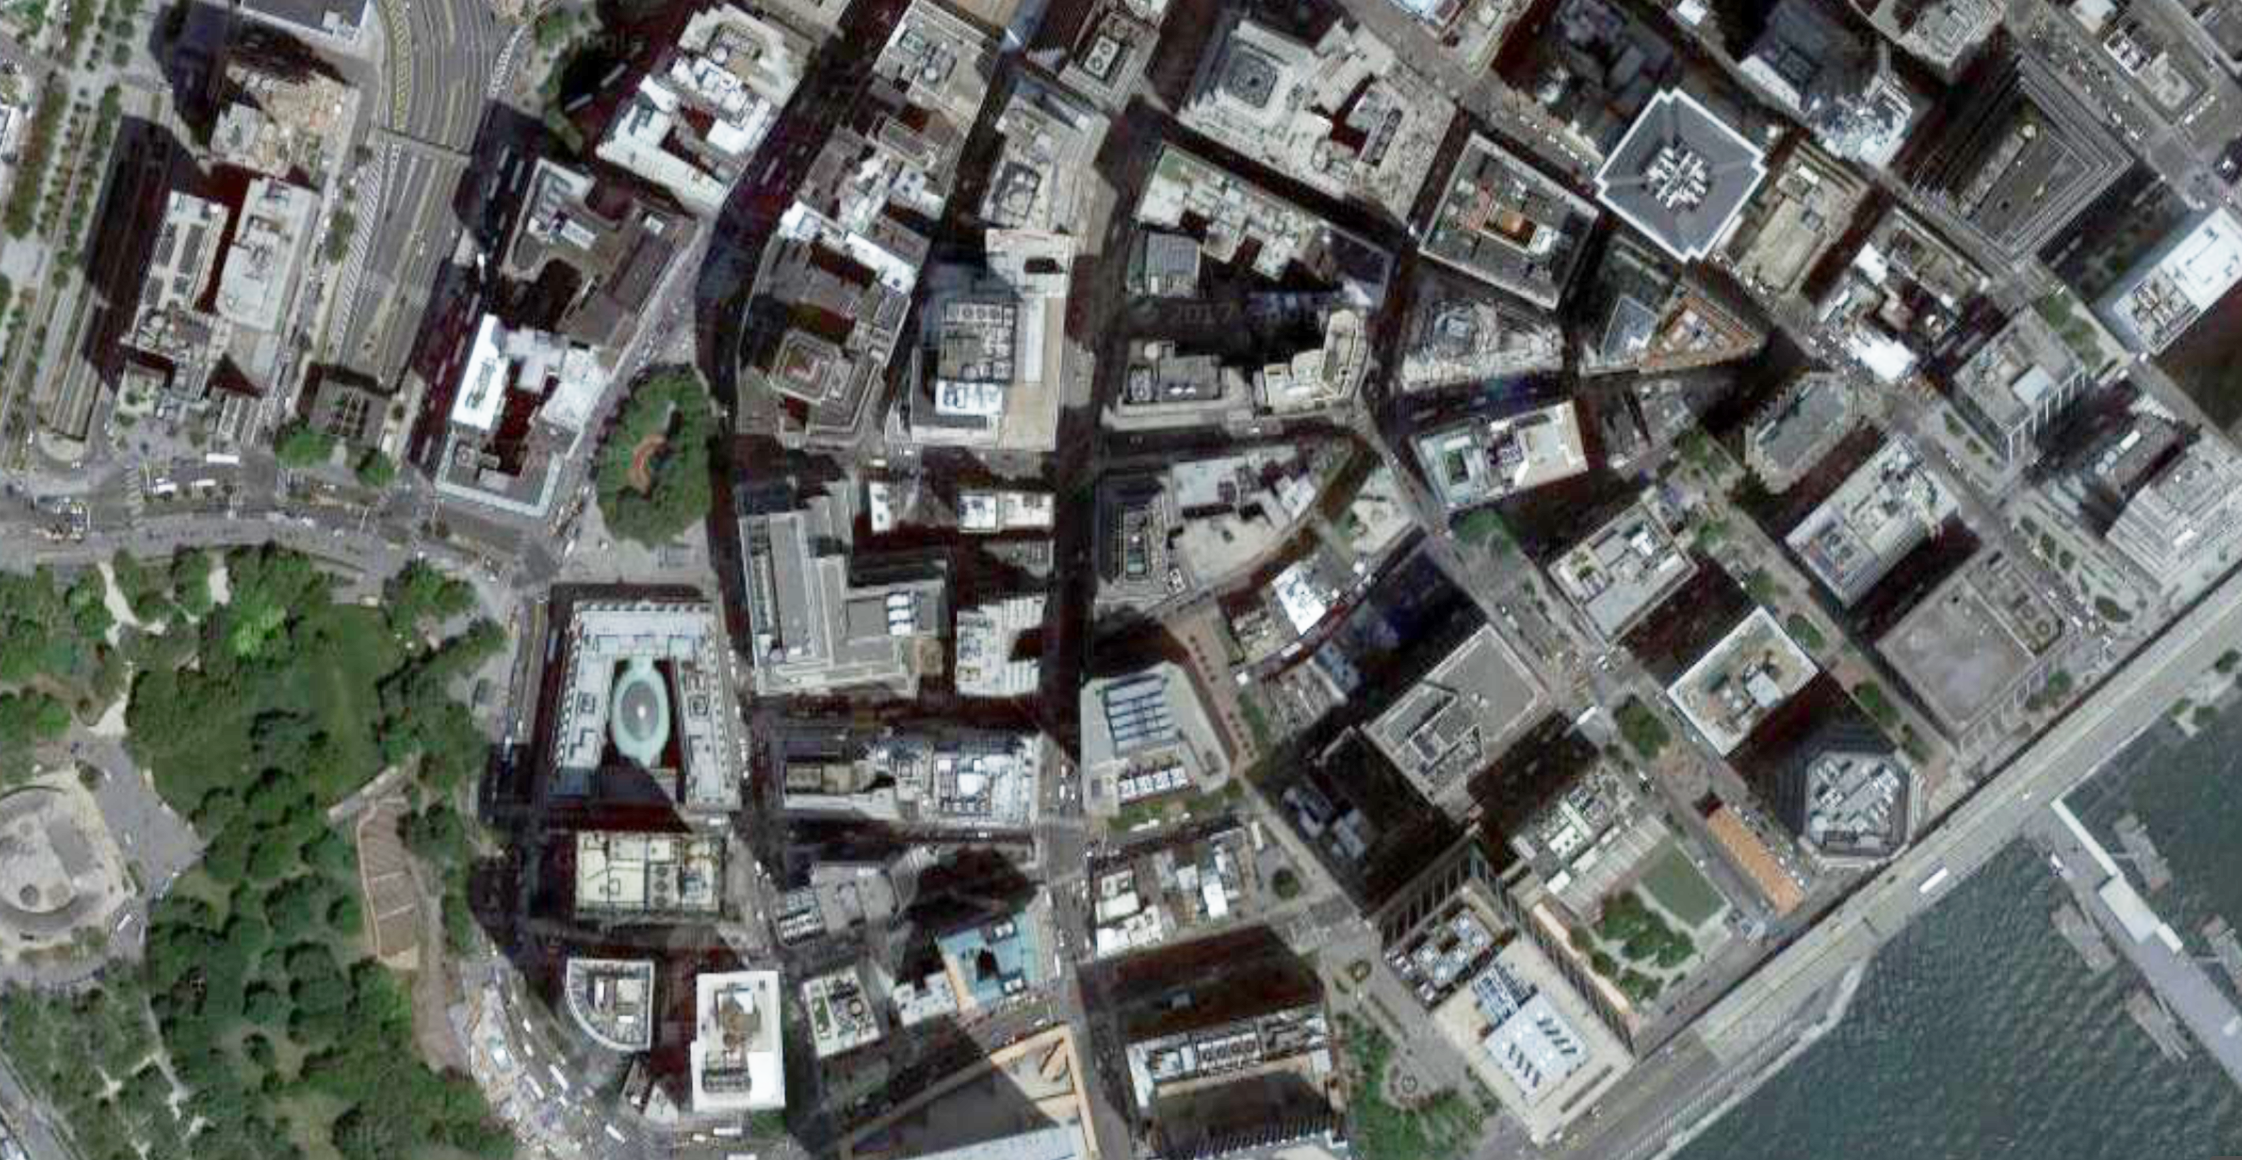
- Central Perspective air photos: with distortion (curvature of earth)
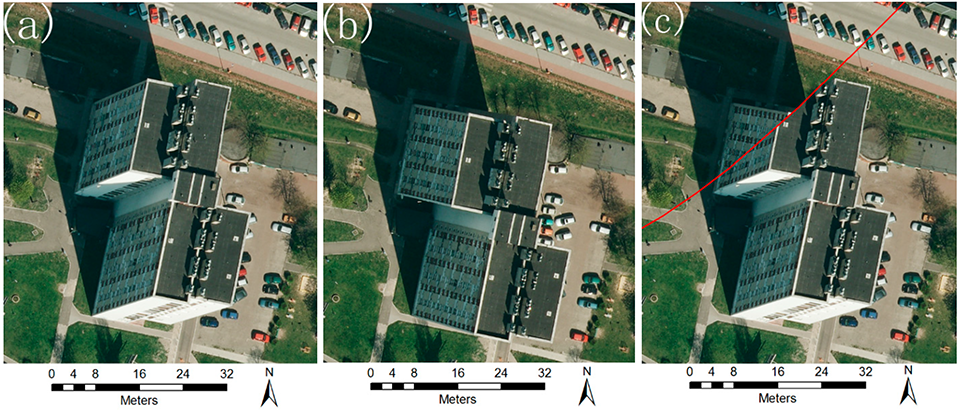
- "Visual discontinuity caused by relief displacement. (a) A building is provided in a digital orthophoto map (DOM); (b) the same building is provided in another DOM, where the original image is captured from a different angle; (c) the building is provided in the mosaicked image of two overlapping images, where the red line indicates the randomly selected seamline."
(Source)
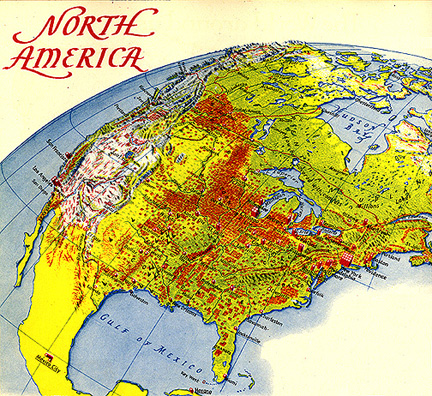
- Parallel perspective: "gods eye view"
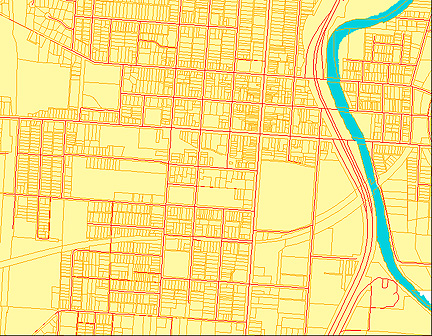
- Plan or Planimetric mapping: maps with a vertical, parallel perspective
- Plan map: Vertical, parallel perspective
- Planimetric air photos: orthophoto: distortions from central perspective removed
2. Map Scale: "the extent of size reduction from the environment to the map; the
ratio of map distance to ground distance"
- review from earlier lecture
- scale: the relationship between the map and the area portrayed
- size of an object on a map compared to the actual object on the ground
- Science Center: 1000 feet long on the ground, and 1 inch long on a map
- the map scale is: 1 inch = 1000 feet
- PDF) Making Maps ch 5
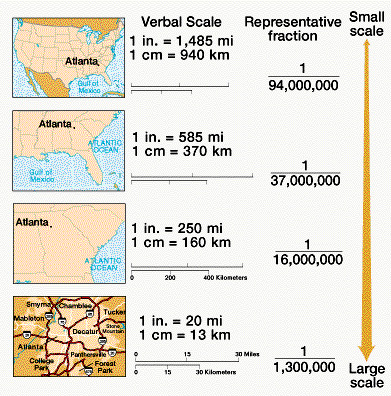
Map Scale Types
- Verbal, Graphic, Representative Fraction scales
- large vs small scale maps
Relationship between scale and what is shown on a map (generalization) and how
things are shown (symbolization): on paper and digital maps:
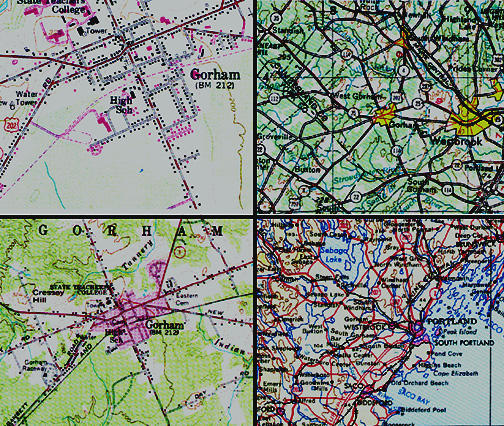
- Basic USGS Map Scales (paper maps)
- Google Maps: scale change and generalization and symbolization
3. Map Generalization: the systematic process of removing detail from (and
sometimes adding detail to) the objects and phenomena to be mapped
Monmonier: "A map that did not generalize would be useless"
- generalization as one of those 'white lies' on maps?
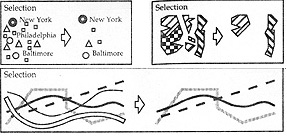
3a. Selection
- Monmonier: Selection
- PDF) Making Maps ch 8
- PROP) Voyager: labeled countries
First step in the generalization process, driven by the purpose of the map:
- we select a few features and don't select most
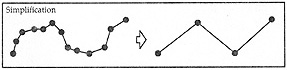
3b. Simplification and Smoothing
The systematic process of removing detail and angularity from the objects and
phenomena to be mapped
- simplification and smoothing occur together when done manually
- simplification and smoothing are distinct processes when done by computer
Simplification: removing detail from a particular feature
- Monmonier: Simplification
- PDF) Making Maps ch 8
- PROP) Voyager: coastlines
Smoothing: changing the location of some of the points and adding new points
to make the line look smoother
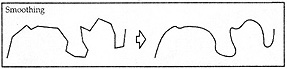
- Monmonier: Smoothing
- PDF) Making Maps ch 8
- PROP) Voyager: coastlines
3c. Displacement
Moving features on the map apart so that they do not interfere with each other
- adding locational errors to map on purpose, for clarity
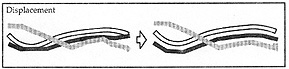
- Monmonier: Displacement
- PDF) Making Maps ch 8
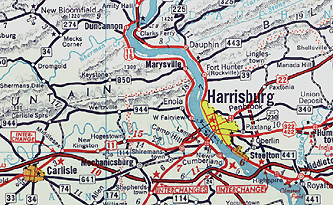
- PA Road map: Displacement
3d. Enhancement
The systematic enhancement of objects and phenomena to be mapped
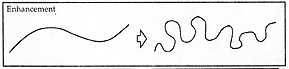
- Monmonier: Enhancement
- PDF) Making Maps ch 8
- PROP) Voyager: flight path
3e. Dimension Conversion
Generalizing from one dimension (point, line, area) into another
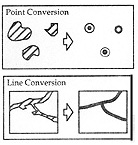
- Monmonier: Dimension Conversion
- PDF) Making Maps ch 8
- areal river converted to simpler line feature
- many smaller areas grouped together as one larger area
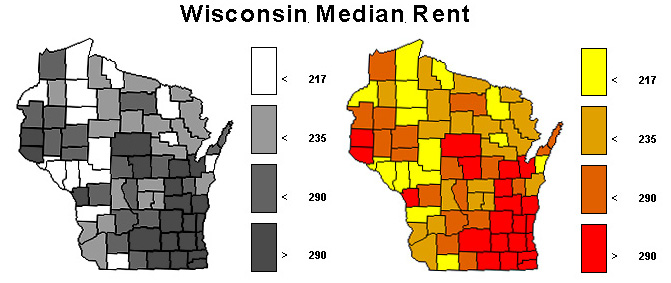
3f. Data Classification:
We classify qualitative data as part of the map generalization process
We classify quantitative data as part of the map generalization process
- Allows us to more easily see patterns
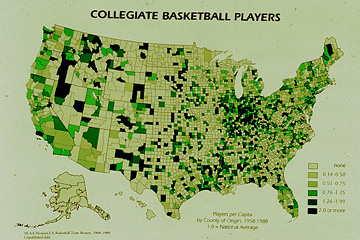
- Choropleth Map: Percent basketball players from each county in US
- PDF) Making Maps ch 8
"Classification reflects the point of view taken by those gathering data and
making maps more than it does inherent phenomenal traits. There are no classes in
reality; classes are the product of human cognition."
Two basic elements of classification: number of classes and class breaks
Number of Classes
How much do we aggregate our data together?
Qualitative data classification
- High and low levels of aggregation
- ex) high level of aggregation
- ex) medium level of aggregation
- ex) low level of aggregation
Quantitative data classification
- choropleth map
- data associated with particular areas: countries, states, counties
- usually classified: number of classes and set class limits
- Demo) ArcView
- PDF) Making Maps ch 8
- Change number of classes: change patterns
Class Breaks (or limits)
Given a set number of classes (5, 6, 7, etc.), where do you place breaks between the classes?
- PDF) Making Maps ch 8
Qualitative (nominal) geographic data
- High and low levels of aggregation
Quantitative (ordinal, interval, ratio) data it is a bit more complicated
Common Class Break Schemes
Equal (or constant) interval
- Constant interval within each class
- ex) divide into five equal interval classes: Total Ostrich Farms in each county in New Hampshire
- data range from 0 to 100:
- 0 3 8 9 10 11 | 27 29 36 | 45 55 | 67 | 88 91 100
- five equal interval classes: better: non-overlapping class ranges (legend):
- 0 - 20
- 21 - 40
- 41 - 60
- 61 - 80
- 81 - 100
- five equal interval classes: overlapping class ranges (legend):
- 0 - 20
- 20 - 40
- 40 - 60
- 60 - 80
- 80 - 100
- PDF) Making Maps ch 8
- Advantages and Disadvantages of Equal Interval Classification
Quantiles
- Equal number of data values in each class
- ex) divide into five quantile classes: Total Ostrich Farms in each county in New Hampshire
- data range from 0 to 100
- 0 3 8 | 9 10 11 | 27 29 36 | 45 55 67 | 88 91 100
- five quantile classes: class ranges (legend):
- 0 - 8
- 9 - 11
- 27 - 36
- 45 - 67
- 88 - 100
- PDF) Making Maps ch 8
- Advantages and Disadvantages of Quantiles Classification
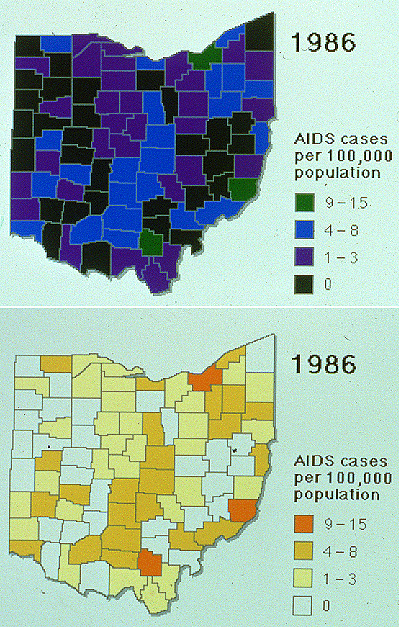
Important: You will see different patterns depending on how the quantitative
data on a map has been divided up
- PDF) Making Maps ch 8
Data Classification and the 2010 U.S. Census Data
1. Go to this data table of selected social characteristics (by U.S. State)
2. Click on Back to Search tab.
3. Click on Geographies button (to the left).
4. Click on All States within the United States in the list under Geography Name.
5. Close the Geographies window (hit X in the upper right corner of the pop up window).
6. Click on SELECTED SOCIAL CHARACTERISTICS IN THE UNITED STATES (DP 02, second in list).
7. Click on Create a Map
8. Scroll down and click on a row of data you are interested in seeing mapped (click on the first number in the row)
9. Hit Show Map on pop-up window.
10. Click on Colors and Data Classes. You can change the number of classes (5 is default) and the classification scheme (four options)
11. Using the same data set (row):
- set classing method to Natural Breaks
- Create a map with 3 classes
- Download then choose JPG format. Hit OK then Download from the pop-up window.
- Create a map with 7 classes
- Download then choose JPG format. Hit OK then Download from the pop-up window.
12. Using the same data set (row):
- set number of classes to 5
- Create a map with natural breaks
- Download then choose JPG format. Hit OK then Download from the pop-up window.
- Create a map with quantitle classes
- Download then choose JPG format. Hit OK then Download from the pop-up window.
- Create a map with equal interval classes
- Download then choose JPG format. Hit OK then Download from the pop-up window.
13. Place your five JPG maps into a Word or Open Office document. Compare the two maps with 3 and 7 classes, as well as
the three maps with three different classification methods. Jot down some notes about the differences you see, and
email me the document.
4. Map Symbolization
Vital, final step in the map abstraction process
Symbol: A thing representing something else because of relationship,
association, convention, or resemblance.
Map symbolization: the systematic process of creating graphic marks which
represent the objects and phenomena to be mapped
- PDF) Making Maps ch 9
4. Cartographic Design Structures: Visual Variables
How do you logically link data to graphic marks on the map?
- The process of map symbolization...
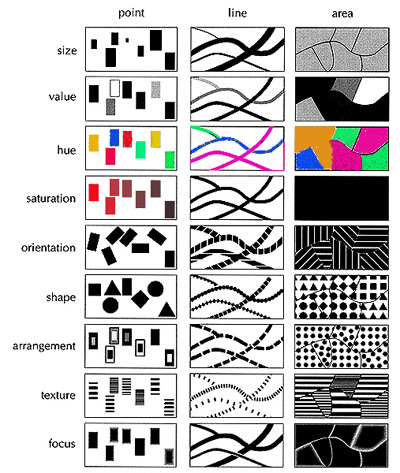
4a. The visual variables
4b. How to use the visual variables as a guide to design and symbolization
- Understand the spatial dimensions of the data you are displaying
PDF) Making Maps ch 10
- point data and graphic mark: no dimensions, just location (x,y)
- line data and graphic mark: one dimension
- area data and graphic mark: two dimensions
- somewhat arbitrary
- Understand the level of measurement of the data you are displaying
PDF) Making Maps ch 10
- Qualitative (nominal): distinctions of kind or quality with no implied order
- Quantitative (ordinal, interval, ratio): ordered, numerical data (low to high)
- Decide on the appropriate visual variables to represent your data
PDF) Making Maps ch 10
- matching the data to graphic marks in some logical manner: symbolization
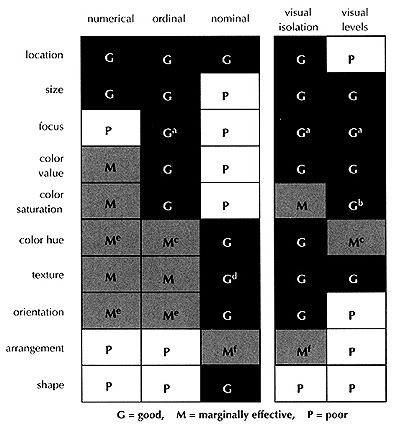
4c. A few Important Visual Variables Described and Illustrated
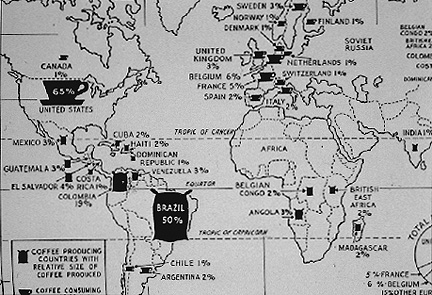
Size: changes in size imply a quantitative difference
- PDF) Making Maps ch 10
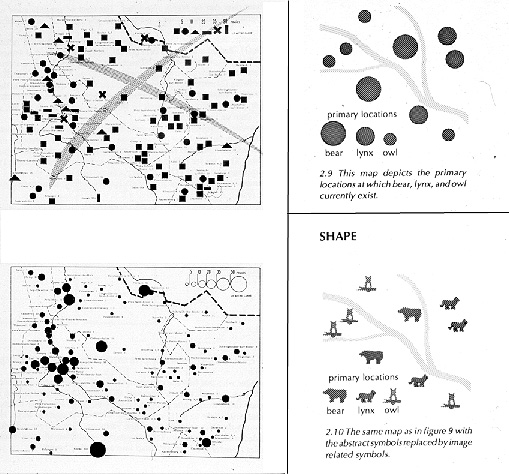
Shape: changes in shape imply a qualitative difference
- Shape and Size
- PDF) Making Maps ch 10
Color Value: value is the variation in lightness or darkness of a color and
implies quantitative difference; usually light means less and dark means more
Color Hue: usually what people associate with the word "color," hue implies
a qualitative difference
- PDF) Making Maps ch 10
- if you want to use hue to represent a qualitative difference, keep the value the
same
- if you want to use value to represent a quantitative difference, keep the hue the
same
Visual Variables can be used together:
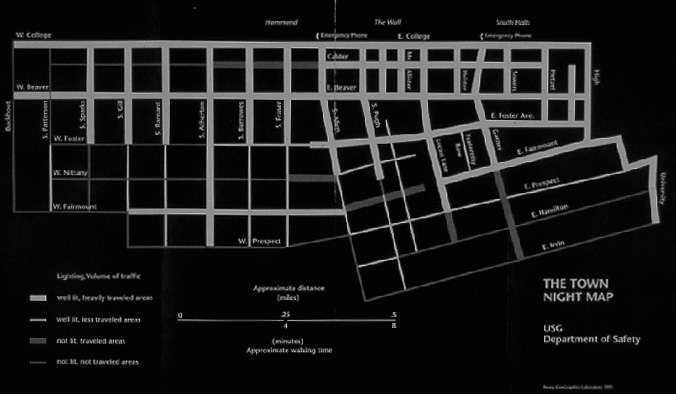
State College Night Map
- PDF) Making Maps ch 10
Sum: Map Abstraction and Infrastructure
Map (or cartographic) Abstraction: "the process of transforming geographic data,
which represents the actual human and physical environment, into a map
All vital steps in transforming geographic data into a visual representation of
that geographic data: a map
1. Map Content: given the infinite detail in the physical and human environment,
what is selected to be mapped and at what scale?
2. Map Scale: "the extent of size reduction from the environment to the map; the
ratio of map distance to ground distance"
3. Map Generalization: the systematic process of removing detail from (and
sometimes adding detail to) the objects and phenomena to be mapped
- selection, simplification/smoothing, displacement, enhancement, dimension conversion, and classification
4. Map Symbolization: the systematic process of creating graphic marks which
represent the objects and phenomena to be mapped
E-mail: jbkrygier@owu.edu
...to Geog 222 Main Page and Course Description
...to krygier teaching page.
...to krygier top page.
OWU Home
OWU Geology and Geography Home