

The Science of Success in Cartography
J.B. Krygier
Published in Globehead! The Journal of Extreme Geography (Volume 1: Thing 1, 1994)
ABSTRACT: This startling research involves the evaluation of
a wholly objective set of data based upon scores on an introductory cartography
exam regressed against the test-taker's coffee consumption per week, home
distance from a bar, and ownership of a genuine Leroy© lettering set. This
analysis is part of the ongoing investigation into what makes a successful
cartographer, a question of vital importance to our nation and the world.
KEYWORDS: Science, Cartography, Coffee, Bars, Genuine Leroy Lettering
Set
Introduction
While it may be argued that good grades on introductory cartography exams do not necessarily relate to success in the glamorous world of production cartography, it must be remembered that only those students who do well on cartography exams are allowed to compete for those highly desirable jobs where they can earn nearly $12,000 a year! Therefore, anything at all we can quantify about success in cartography is of interest to everybody.
Variables and Analysis
The variables involved in this analysis were carefully selected by specially trained analysts at the world renowned IASBS. (note 1) The IASBS sent undercover agents to various schools offering classes in cartography; their investigations resulted in the selection of several variables which seemed to be significant to this study. The variables, as mentioned above, are coffee consumption, distance to nearest bar, and ownership of a genuine Leroy© lettering set. (note 2)
Coffee consumption was chosen as a variable because of several subtle clues that the IASBS agents noticed:
1. coffee makers in every cartography lab investigated; often proudly listed on cartographic lab promotional brochures.
2. work ruined by errant coffee spill a valid excuse for late work at 78.58% of cartographic labs investigated.
3. special coffee session at American Congress on Surveying and Mapping annual conference ("Using Caffeine and a Pen to Simulate Complex Coastlines," "Coffee Spilled in the Computer Keyboard: Will it Really Blow up Your Computer?)
Distance (from home) to the nearest bar was chosen to cover both the spatial and the social aspects of the study, a variable to keep the geographers and humanists in the audience satisfied. (note 3) Finally, the ownership of a genuine Leroy© lettering set was included to cover the material aspects of the study to keep the capitalists and marxists content.
Discussion
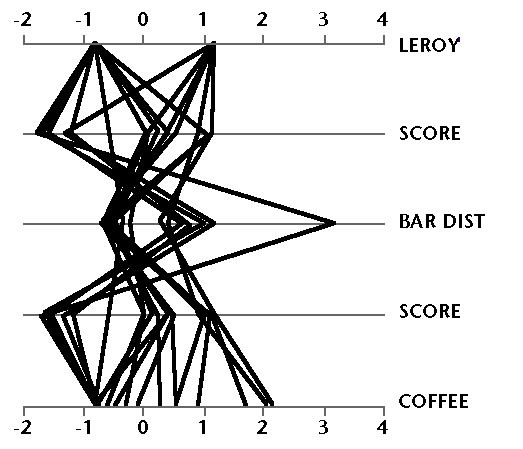
The regression analysis was relatively successful in accounting for the variation in the dependent variable, test scores. Just a hair under 89% of the variation in test scores was accounted for by variation in the three independent variables. (note 4) Coffee consumption has a strong positive correlation with test scores (standardized estimate = .555), ownership of a genuine Leroy© lettering set has a very weak positive correlation with test scores (standardized estimate = .088), and distance from bars a strong negative correlation (standardized estimate = -.593). A parallel coordinate plot of the data (fig. 1) reveals the strong positive correlation between score and coffee; the strong negative correlation between score and bar distance; and the weak positive correlation between score and Leroy©. (note 5)

figure 1
Intercorrelation was noticeable in all of the independent variables. The most intercorrelation occurred between the coffee and Leroy© variables (.48). This means that to some extent coffee and Leroy© are measuring the same thing. Intercorrelation between coffee and bar distance (-.24) and bar distance and Leroy© (-.12) was not as significant.
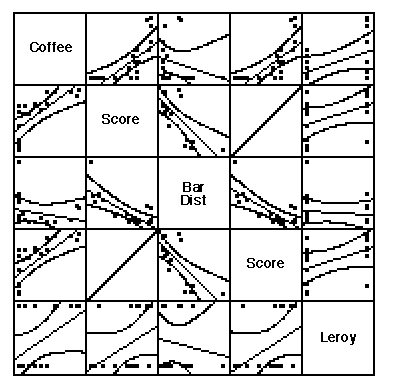
The relationship between exam score and coffee consumption was strongly positive within relatively tight 95% bounds of confidence (fig. 2). (note 6) In addition, none of the points exert an inordinate amount of influence on the correlation coefficient of this relationship (fig. 2). (note 7) A whopping t-test probability of .0001 suggests that chance sampling fluctuation is not an issue here. The strong positive relationship between exam score and coffee consumption may be explained in several ways. First, it is possible that those students who studied more (into the wee hours of the night) need coffee to stay awake. On the other hand, those students most desirous of attaining stardom in the world of cartography may actively imitate the employees of the cartographic lab and graduate students who openly and unabashedly suck coffee by the gallon. (note 8) Such aspirant students would be more likely to attain better grades on their exams than their more phlegmatic counterparts.

figure 2
The relationship between exam score and distance to a bar was strongly negative with relatively tight 95% bands of confidence and no highly influential points (fig. 2). A t-test probability of .0001 suggests that chance sampling fluctuation is not an issue here. The negative relationship between exam score and distance to a bar may seem puzzling at first. One would think that the closer a bar to home the more the temptation to slink out for malicious imbibement, and the lower the exam score - dead brain cells, less study time, etc. Yet such a hypothesis is surely dashed to pieces on the rocky shore of Science by the results of this regression analysis. The negative relationship may be attributable to the necessity for socializing. Hours spent hunched over dim light tables pushing pens around in circles, or squinting at flickering computer monitors necessitate some kind of release. The nearness of a fine bar would certainly positively affect attendance at said bar. Those students who do not seek such release, who are assiduously denied ease of attendance due to the factor of distance, are doomed to muddled minds and low exam scores. (note 9)
The dummy variable relating to ownership of a genuine Leroy© lettering set has little effect on the analysis at hand. This once proud means of producing fine manual lettering has fallen to the depths of obsolescence with the coming of "rub-on" lettering and the computer. Whereas once no cartographer would be caught dead without his or her genuine Leroy© lettering set, few young aspiring cartographers even know what it is anymore. The numbers in the regression analysis reveal the melancholy decline of the genuine Leroy© lettering set. Damning is the fact that the coefficient of determination in the regression analysis rises merely .61% (from 88.38% to 88.99%) when the Leroy© variable is added to the analysis. The t-test of the Leroy© variable reveals a score of .938 which has a probability of .3620 associated with it, a value leaving us with little confidence in the significance of the variable. The Leroy© variable is also significantly intercorrelated with the coffee variable. In any case, it would be best to not use the Leroy© variable in this analysis.
In conclusion, the regression of test scores on a cartography exam regressed against coffee consumption, distance to nearest bar, and ownership of a genuine Leroy© lettering set revealed a strong relationship among exam scores, coffee and bar distance variables: standardized scores (.55 vs. -.59) reveal an almost equal effect of these two variables on the dependent variable, test scores. Ownership of a genuine Leroy© lettering set was found to be of little or no consequence in the regression analysis. This study suggests that all aspiring cartography students consider the distance from a bar as a primary determining factor in locating a place to live; in addition, all young cartographers should include coffee consumption in their day to day routine. It sure tastes great, and it's good for you too! (note 10)
Notes
note 1: Institute for Advanced Studies in Big Science.
note 2: A genuine Leroy© lettering set consists of a set of ink pens and a set of templates for the various letters of the alphabet. A mechanism allows the user to easily line up letters into words. It provides a cheap and easy means of applying lettering to traditionally constructed maps.
note 3: Alas, the variable does not measure the number of times the subjects visited the bars. Divulgence of such a statistic was seen as an unnecessary violation of the sacred rights which undergird this great nation. And besides, I was threatened with bodily harm if I included the numbers.
note 4: Coefficient of determination = .8899. The coefficient of correlation, at .9433, is even more impressive looking, and although meaningless, should be used in any official report of the findings of this investigation.
note 5: In a parallel coordinate plot, negative correlations between variables result in much cross-over of vertical lines in the plot between the axes of the two variables; positive correlations result in minimal cross-over. The data in the plot has been standardized.
note 6: Figure 2 consists of all of the bivariate plots of the data in this study. The curved lines represent the bounds of 95% confidence.
note 7: Figure 2 was created as an influence plot, and the size of the dots reveals their relative influence on the regression line. Since all dots are approximately the same size, no specific points exert undue influence.
note 8: Coffee consumption by cartographers has undoubtedly increased since the advent of the computer for mapping. No longer need one fear splashing a good hot cup of java all over a meticulously crafted graduated circle map; no longer need one fear a fine, wholesome, steaming cup of strong dark coffee sliding off the angled surface of the old-fashioned light table and calamitously crashing to the floor.
note 9: The friction of distance comes into effect here. However, we all must remember that the effect of distance cannot be separated from spatial patterns folded into the gravity model.
note 10: Thanks to the Association of Pennsylvania Tavern Owners and the International Association for the Advancement of Coffee Consumption for funding and providing the data for this study.
E-mail: jbkrygier@owu.edu