Geography 353 Cartography and Visualization
...to Geog 353 Main Page and Course Description
...to Geog 353 Syllabus
...to Geog 353 Course Schedule and Lecture Outlines
...to Geog 353 Laboratory Information and Student Projects
Geog 353 Lecture Outline: Map Generalization and Classification
Update: 10/13/19
We will review chapter 8 (Map Generalization and Classification) from the
Making Maps book. Additional information and examples can be gleaned
from the material below.
- Making Maps PDF) Ch 8. Map Generalization and Classification
- Data Classification in ArcGIS
- right-mouse-click on layer you want to classify data, then select Properties
- The Symbology tab takes you all symbolization options.
- In the upper left window, select quantities.
- Graduated color is the choropleth map.
- other options: Graduated Symbol, Proportional Symbol, Dot Denisty Maps
- Select Classify for more options.
Data Classification
Introduction
Recent Lectures: Issues concerning map symbolization: choosing visual marks to effectively
represent the points, lines, and area data of our base maps and thematic data
Effective representation of intellectual hierarchy with a visual hierarchy
Visual variables
Next: ways to logically match the dimensions of your data (point, line, area)
to symbols on your map
Requires understanding
- your thematic data and how your process it >> data classification
- graphic symbolization methods for data at points, lines, and areas
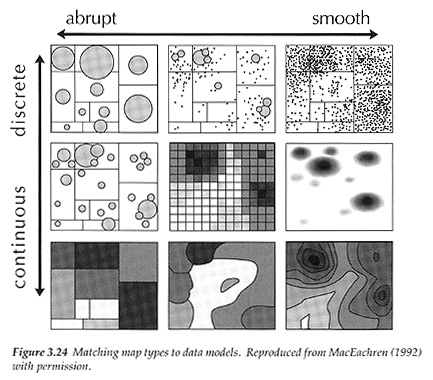
- more complex issues of symbolizing data in areas
1. Data Classification
Data is usually classified - put into some categories or groups - before it can
be displayed
Different ways of classifying data will lead to different patterns on the map
Classification is a form of cartographic generalization which reduces the
complexity of a set of thematic data
Classification: start by differentiating between
- categorical (nominal, ordinal) data
- numerical (interval/ratio) data
Categorical (qualitative, nominal) data classifications
Dealing with nominal (qualitative) data or data that is ordered but without a
measurable range (rare as a type of mappable thematic data)
There are no absolute rules for this kind of classification, just general guidelines
- Features in the same class or category should be more similar than dissimilar
and should be symbolized similarity
- Features in different classes or categories should be more dissimilar than
similar and should be symbolized differently
- Be aware of how others have classified information:
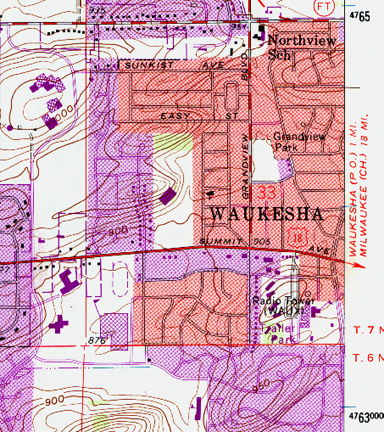
- USGS Topographic Map, Waukesha Wisconsin
Numerical data classifications
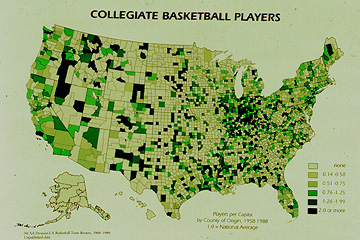
- College Basketball Players per 1000 population
Ordered data with a measurable range: quantitative data
- interval and ratio levels of measurement (combine)
Two big issues involved in the classification of numerical or quantitative data
- the number of classes you divide your data into
- the specific way you divide the data into those classes
Number of classes:
Most maps for presentation purposes should have four to six classes
As you change the number of classes you may very well see different patterns:
- 1 class vs 62 classes vs 5 classes:
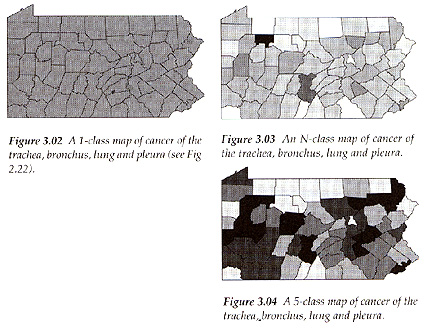
- MacEachren 3.05: same data, different classes
Important to vary the number of classes and see what happens before you make a final choice
Number of Classes in ArcView
- Legend Editor: double click on legend in a view
- Legend Type: graduated color (choropleth)
- classification field: the data to map
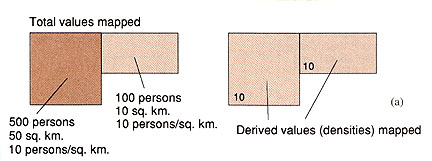
- normalize by: area
- ex) Hispanic Population: totals vs normalized (Texas vs New Jersey)
- classify: number of classes
Number of Classes in ArcGIS
- right-mouse-click on layer you want to classify data, then select Properties
- The Symbology tab takes you all symbolization options.
- In the upper left window, select quantities.
- Graduated color is the choropleth map.
- Select Classify for more options.
Also important is the way you divide up data: classification schemes
- the breaks (boundaries) between classes
Data classification schemes
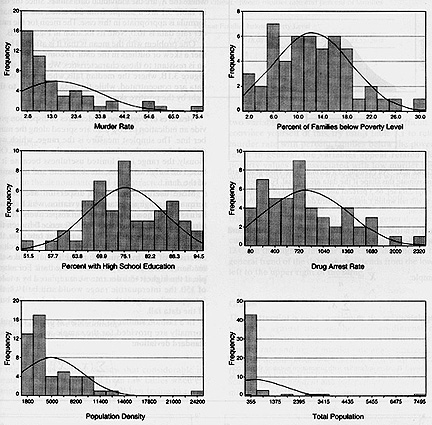
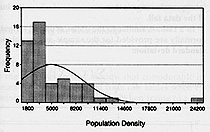
- Slocum 3.2: Histograms
Histogram: graph relating data distribution and frequency
Some classification schemes take into account the distribution of the data, and
others do not.
1. Exogenous schemes: class boundaries defined by criteria external to
distribution of data
- ex) income data classified into tax brackets
- ex) hunger data classified into classes based on criteria for adequate nutrition
- ex) ethnic population based on % required for state to get grant
Advantage: map can be matched to external criteria
Disadvantage: does not take into account the data distribution
Exogenous schemes in ArcView
- double click on and edit numbers in the Legend Editor
- change both value (for classifying) and label (for labeling in view legend)
- + and X are add and remove classes
Exogenous schemes in ArcGIS
2. Arbitrary schemes: class boundaries are set by arbitrary criteria
Equal Intervals: class boundaries are defined by rounded numbers or regular divisions
- ex) 0% - 100%, 100% -200% ...
Often chosen because the classification looks tidy
Simple to do by hand:
- find the range of the data (high value - low)
- find the common difference of the data (range / number of classes)
- find the class limits:
- first class limit = low value + 1 x common difference
- second class limit = low value + 2 x common difference
- and so on
Advantages:
- useful when you need to compare a series of maps
- easy to interpret and understand
- works best with data has a rectangular distribution (rare in geographic phenomena)
Disadvantage: not sensitive to the data distribution (if not rectangular)
Equal Interval schemes in ArcView
- Legend Editor >> Classify >> Equal Intervals
- divides the range of attribute values into equal sized sub ranges
- problem: not tidy
- solution: go back and start with 0 and impose a more tidy looking scheme
Equal Interval and Defined Interval schemes in ArcGIS
3. Ideographic schemes: class boundaries defined by the shape of the data distribution
Ideographic schemes take more effort because they are chosen based on some
characteristics of the data distribution itself
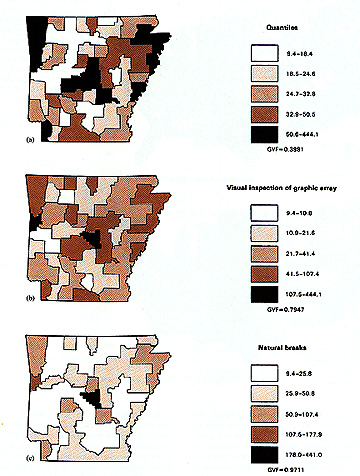
3a. Natural Breaks: Attempt to find natural breaks in the data; classify data
into groups that are somewhat distinct from each other. Can do this by hand
using a cumulative frequency graph (or graphic array) and then look for natural
breaks in the data and put class breaks at those points
A good default method: good to start with this and see if it works
How to do it: start by creating a histogram
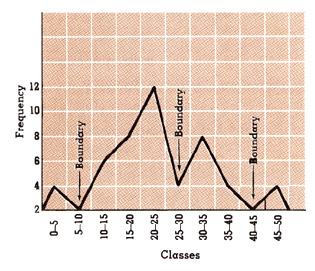
- Dent 6.11: Natural Breaks in Histogram
- hopefully you will see some "boundaries" in the graph
- class boundaries placed at locations having lower frequencies or breaks in the graph
Advantages:
- takes data distribution into account
- intuitive
- very flexible
- good default for single map with clear breaks
Disadvantages:
- breaks not always obvious: consider a different classification method
- too many breaks obvious: consider a different classification method
- gets more tedious as data sets get larger
- replicable from person to person, poor for comparing several maps
- ...but...
Natural Breaks in ArcView
- Legend Editor >> Classify >> Natural Breaks
- based on Jenks Classification Algorithm
Natural Break (Jenks) scheme in ArcGIS
3b. Quantiles: puts an equal number of values in each class
- quartiles is four percentile classes (25% each)
- quintiles is five percentile classes (20% each)
- deciles is 10 percentile classes (10% each)
Easy to calculate
- create a list of all data values in ascending order
- number of values in each class = total number of values / number of classes
- start with lowest value, include correct number of values in lowest class...
- ...the correct number of values in the second lowest class, and so on
Advantage:
- good for skewed data sets IF you want to "flatten" it out
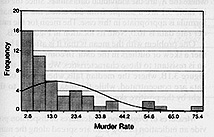
Disadvantage:
- flattens out data distribution: hides fact that data is skewed! Bad Map!
- bad for skewed data distributions (MacEachren example, p. 46-47)
Quantiles in ArcView
Quantile scheme in ArcGIS
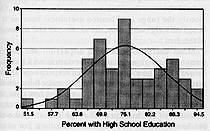
4. Serial schemes: class boundaries are defined by statistical or mathematical functions
Standard Deviation
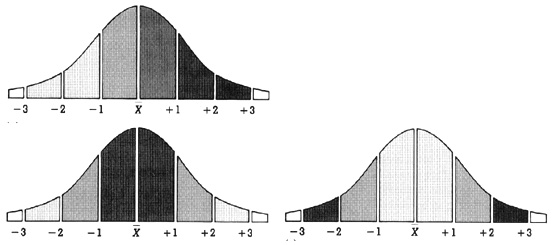
- Dent 6.9: Standard Deviation and Symbolization Schemes
Class boundaries determined by the mean and standard deviation
- median: middle value in an ordered (low to high) data set
- half the values in the data set will be above the median, half below
- mean: average of a data set: more important for statistical purposes
- add all values together and divide by the number of values in the data set
Normal distribution: values near the mean occur more often
- the greater the deviation from the mean (average) the less often a value occurs
Other distributions: not normal: more dispersed
- dispersed data: many more of the values not near the mean
- flat distribution, rectangular distribution
Standard deviation: a measure of how dispersed a set of data is
- comparing two data sets:
- the smaller the standard deviation, the less dispersed the data
Advantages:
- useful for normal (bell shaped) distributions
- useful when you want to focus on areas that deviate the most or least from 'average'
- useful when mapping linked to statistical analyses including mean and standard deviation
Disadvantages:
- the mean and standard deviation should be understood by user
Standard Deviation schemes in ArcView
Standard Deviation scheme in ArcGIS
5. Unclassified Schemes
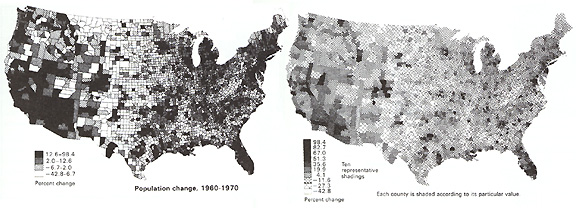
- Dent 6.14: Classed and Unclasssed Map of Population Change
"Unclassed" choropleth maps: the number of categories is equal to the number of data values
Each value has a unique symbol
- ex) range of values from 0 to 100 represented with 0% to 100% black
Advantages
- minimizes the amount of generalization and simplification
- good for seeking patterns
Disadvantages
- minimizes the amount of generalization and simplification
- poor for picking out categories
Unclassified Schemes in ArcView or ArcGIS
- How to do?
- set number of classes to number of values in data set
Sum: data classification
1) categorical (nominal, ordinal) vs numerical (interval, ratio) data
- categorical classification: mostly qualitative
- numerical classification: quantitative
2) number of classes
3) dividing up data: numerical classification
- 1) exogenous schemes
- 2) arbitrary schemes (equal interval)
- 3) ideographic schemes (natural breaks, quantiles)
- 4) serial schemes (standard deviation)
- 5) unclassified schemes
Change the classification scheme or number of classes and you get a different map
If all three classification schemes are appropriate for the data distribution
then select the classification scheme that best represents what you know about
the actual data distribution.
E-mail: jbkrygier@owu.edu
...to Geog 353 Main Page and Course Description
...to krygier teaching page.
...to krygier top page.
OWU Home
OWU Geology and Geography Home