...to Geog 353 Main Page and Course Description
...to Geog 353 Syllabus
...to Geog 353 Course Schedule and Lecture Outlines
...to Geog 353 Laboratory Information and Student Projects
We will review chapters 6 (The Big Picture of Map Design) and 7 (The Inner Workings of Map Design) from the Making Maps book. Additional information and examples can be gleaned from the material below.
Introduction
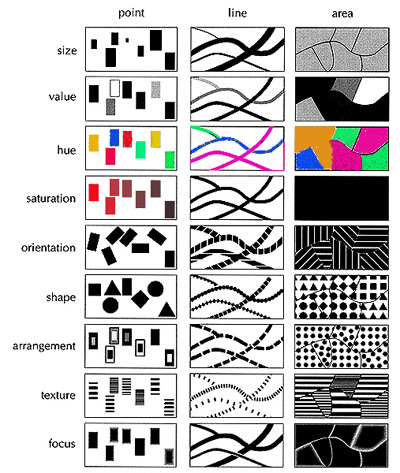
Map symbolization: in essence, choosing visual marks to effectively represent the points, lines, and area data of our base maps and thematic data
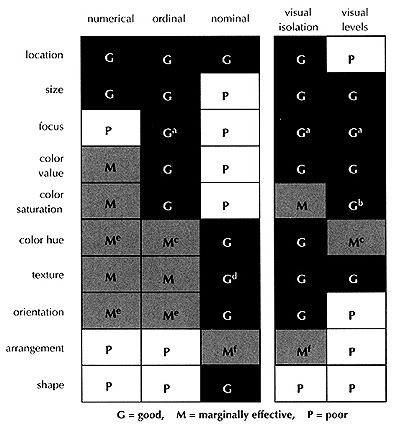
The Visual Variables
Today: visual hierarchy, 'marginal' map information, and editing
1. Visual Hierarchy and Map Design
Importance of understanding a map's purpose prior to making the map
Map purpose drives
It also drives the design of the map
A map's intellectual hierarchy: given the purpose and content of the map
PROP) Voyager Map
Once you make decisions about the intellectual hierarchy you need to choose a
visual hierarchy that adequately represents the intellectual hierarchy
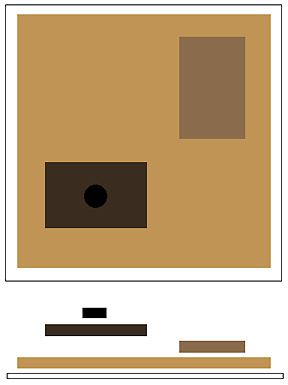
Visual hierarchy adds 'depth' to a flat paper or on-screen map (above).
Failed visual hierarchy (left) limits the map's ability to effectively communicate
Customary Positions of Map Elements in the Hierarchy: higher in intellectual
and visual hierarchy towards top of list, lower in intellectual and visual hierarchy
towards bottom of list. Given a particular map purpose, these may shift in the
intellectual and, thus, visual hierarchy:
Lab Project: Intellectual and Visual hierarchy of your maps and WWW pages
Map elements that are intellectually important should be made to be visually
dominant on the map: how do you do that?
1a. Figure Ground Defined
If we understand how people perceive visual hierarchies, we can use that information to guide the design of the visual hierarchy of a map

Figure ground phenomena

Figure ground on maps will fail if the map is too visually homogeneous
We have to do something on maps to set off that 'automatic perceptual mechanism and to make sure that the figure ground we achieve represents the intellectual hierarchy of the map.
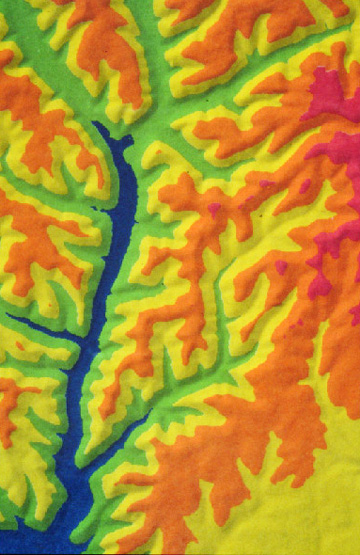
When we achieve figures on maps, they are seen as separate from the rest of the map, have form and shape, appear to be closer to the viewer than the ground, have more noticable color (or value), and are associated with meaning
We can manipulate figure ground to communicate what is most important in the map display, and to organize what the viewer sees to reflect the relative importance of the material on the map.
Next: look at some means of enhancing figure ground on maps (or any visual display)
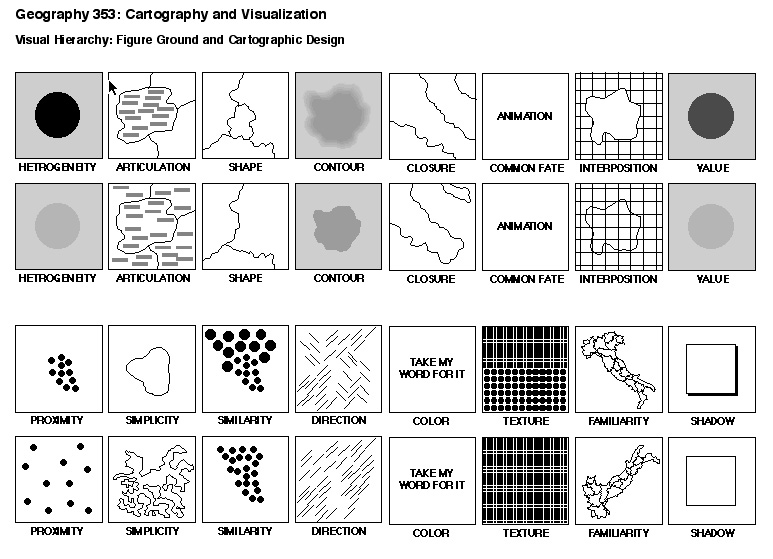
1b. Achieving Visual Hierarchy using Figure Ground
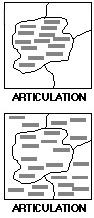
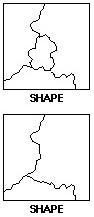
HANDOUT) Figure Ground Examples
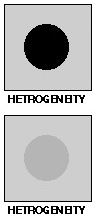
1. heterogeneity: noticeable visual differences tend to separate figure from ground
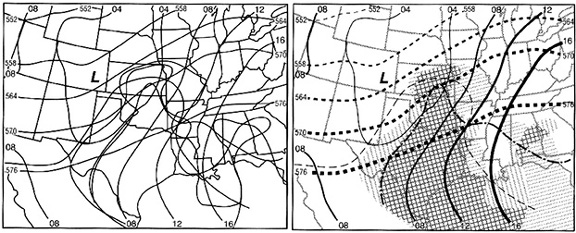
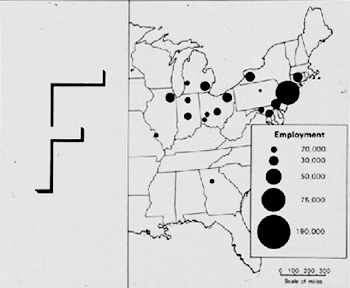
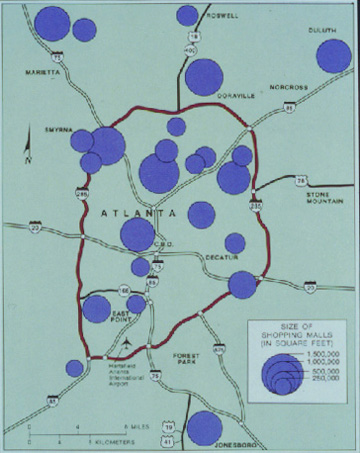
2. articulation: figure has more detail than ground
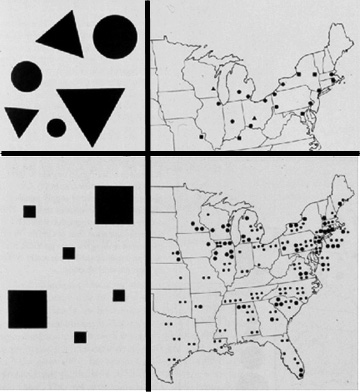
3. shape: figure has shape
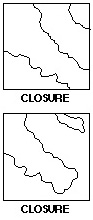
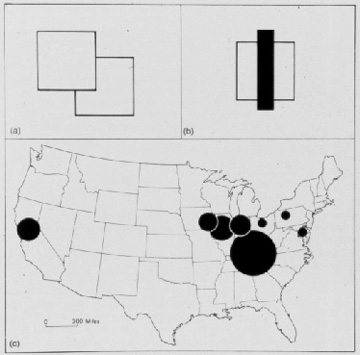
4. contour: objects with sharp, well defined edges tend to form a figure
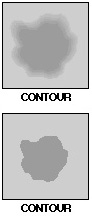
5. closure: closed objects tend to form a figure
6. common fate: objects moving in the same direction tend to form a figure

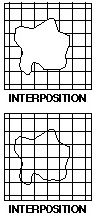
7. interposition: continuance behind a figure
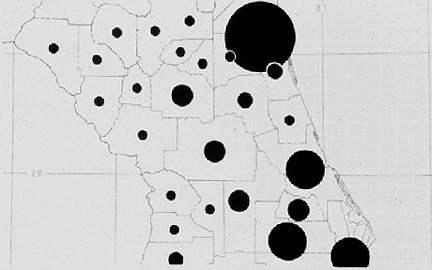
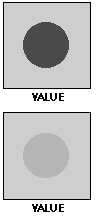
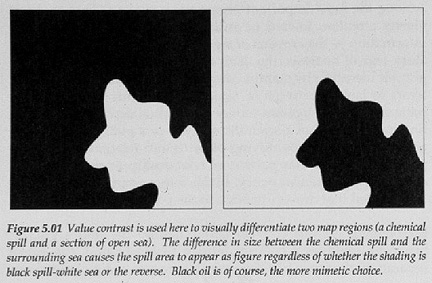
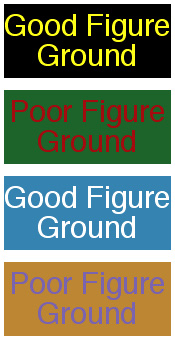
8. value: darker areas tend to be figure
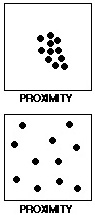
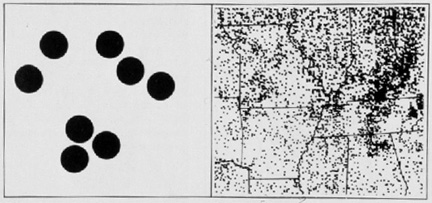
9. proximity: objects close together tend to form a figure
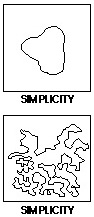
10. simplicity: simple objects tend to form a figure
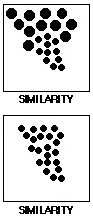
11. similarity: of shape, size, and value tend to form a figure
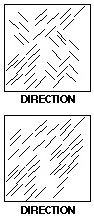
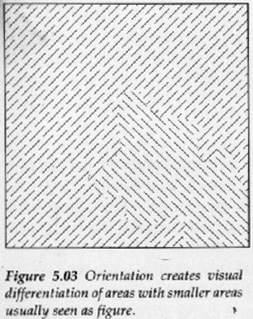
12. direction: objects with the same orientation tend to form a figure
13. color: higher color intensities tend to be figure
14. texture: coarse textured areas tend to be figure
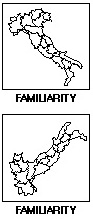
15. familiarity: familiar shapes tend to be figure
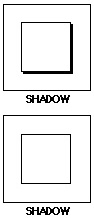
16. shadow: objects which have a shadow tend to be figure
PROP) Voyager Map
Sum: various techniques for using figure-ground phenomena to enhance the visual
hierarchy of your map
2. 'Marginal' Information and Editing
2a. Marginal Information
The stuff that appears around the margins of a map
Titles and labels: establish geographic, topical, and temporal context
Legends
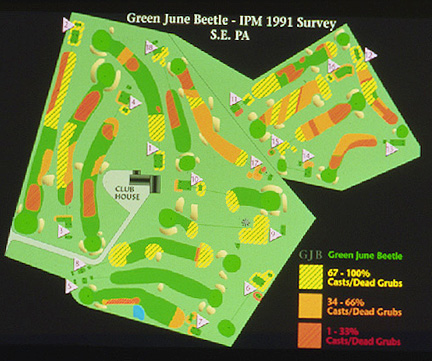
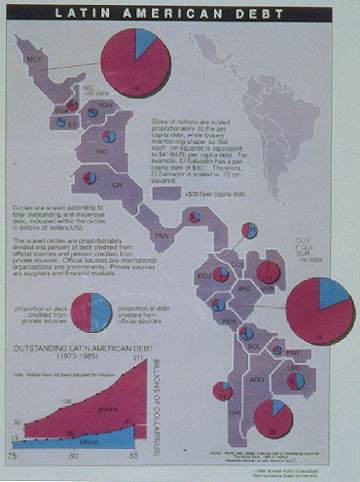
If mapping statistical information, you may want to include a graph of the data
range, standard deviations, etc. - if relevant to the material being mapped
Don't have to put "key" or "legend": waste of space
Base map and thematic data source information
Note all relevant information about base map: source, scale, orientation
When to use north arrow
2b. Editing and Blunders
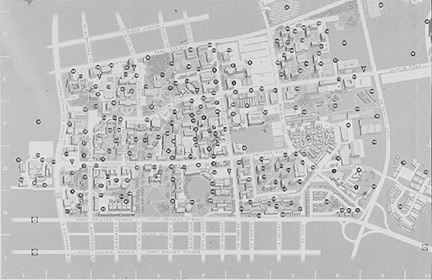
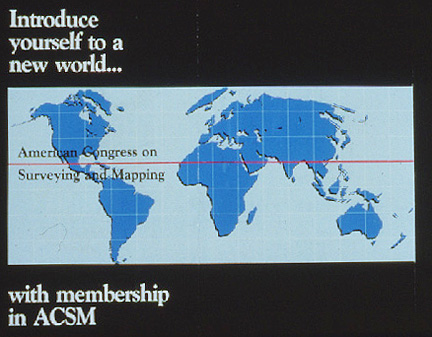 ACSM Map
Conclusions
Map symbolization: choosing visual marks to effectively represent the points, lines, and area data of our base maps and thematic data
Fundamental aspect of map symbolization: effective representation of intellectual hierarchy with a visual hierarchy and basic techniques for doing that
E-mail: jbkrygier@owu.edu
...to Geog 353 Main Page and Course Description
...to krygier teaching page.
...to krygier top page.