Geography 353 Cartography and Visualization
...to Geog 353 Main Page and Course Description
...to Geog 353 Syllabus
...to Geog 353 Course Schedule and Lecture Outlines
...to Geog 353 Laboratory Information and Student Projects
Geog 353 Lecture Outline: How to Make a Map: Introduction to Course, Lab, and Lab Project
Update: 7/8/19
Seeing is Complicated...

- ...and seeing and thinking and understanding is a big part of maps and GIS.
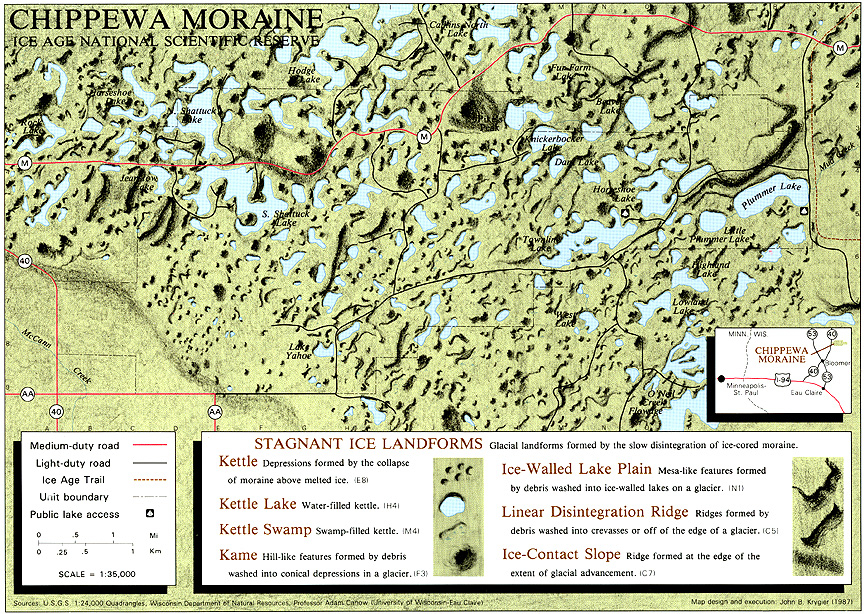
1. Traditional Cartographic Design & Map Production
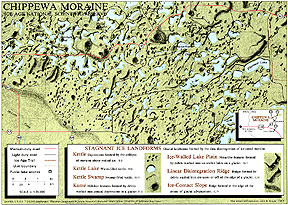
- Chippewa Moraine map
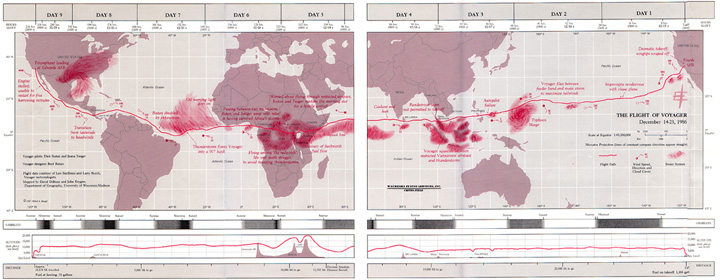
- Flight of Voyager map
- handout copies of map
- What do you need to know to make this map?
- PDF: Making Maps 3rd edition, Ch 1 (How to Make a Map) pp. 24-25.
For a long time maps were kind of the same - mostly on paper, tangible, static... All things we take for
granted but relatively new developments...
2. Post-1980 Developments in Cartography and "Visualization"
Animation: show changing data (of changing phenomena) with a changing / dynamic presentation
- Animated maps: earliest in films around World War 2
- Computer animated maps: late 1960s
- Current status: inexpensive and easy to use software for animation
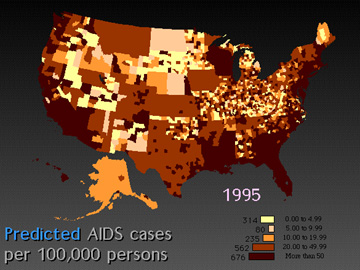
- Screen Shot: The Spread of AIDS in Pennsylvania: Macromedia Director (ca 1982)
- Animated GIFs (mid 1980s):

- Examples: Plate Tectonics (gif)
Animation in Google Earth | KML or KMZ files (2007)
- Example:
Animated Maps in Google Earth (demo)
- Animation with Flash, Python, Java
- Example: Mapping Walmarts
- Dynamic phenomena (changes, moves over time) matched to dynamic presentation (animation)
Interactivity: user can engage with and change the map
- With paper maps you can mentally interact, but not physically interact with a map
- Interactive maps developed as computer mapping developed (1960s onward)
- Screen Shot: SLC Viewer: Global Climate Model Visualization: UNIX software (ca 1985)
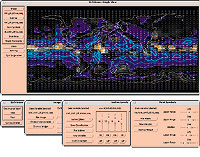
- dots: ocean temperature; grey: atmospheric CO2; blue lines: salinity
- Climate scientists develop computer simulations; simulate past climates in
attempt to understand current and future climates
- 30-40 different variables: temperature, ocean salinity, ocean currents, etc.)
- SLC Viewer: select and view any 1, 2, or 3 variables together
- Shockwave Examples: North America History Maps
- Flash Example: Flash Maps
- Flash Example: Flash Earth
- Flash Example: Ohio is a Piano
- Flash Example: Manhattan Timeformations
- Interactivity: unlike paper maps, the user can change and manipulate interactive maps.
Multimedia/Hypermedia: Combine and link maps with images, graphs, video, and other media
- Atlases are akin to multimedia: maps with text, images, graphs, etc.
- digital multimedia and hypermedia: digitally connected text, images, graphics, video, sound
- Development of multimedia/hypermedia software in the 1970s onward, boom with the internet & WWW
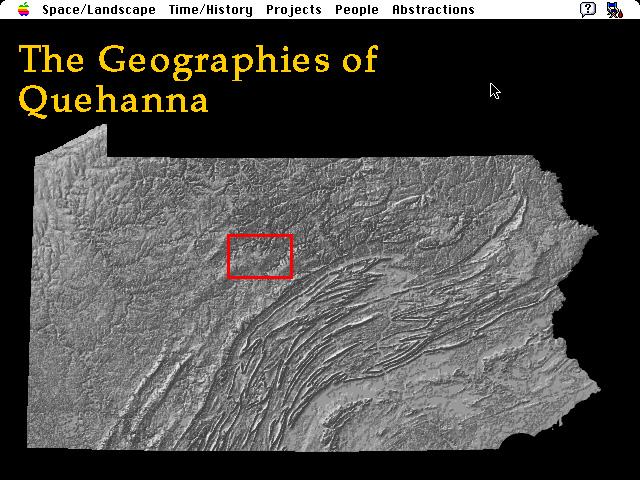
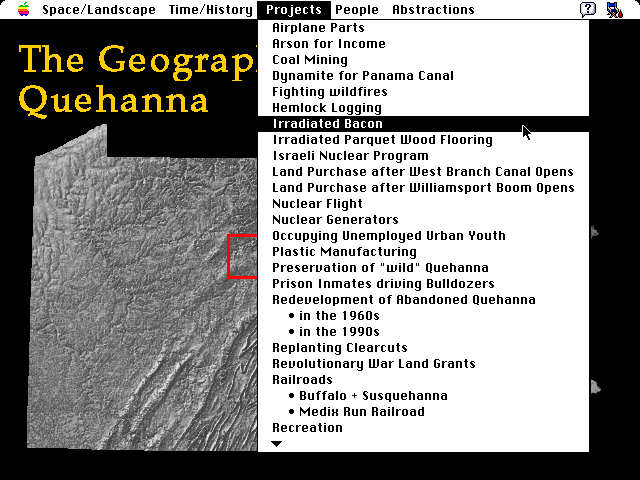
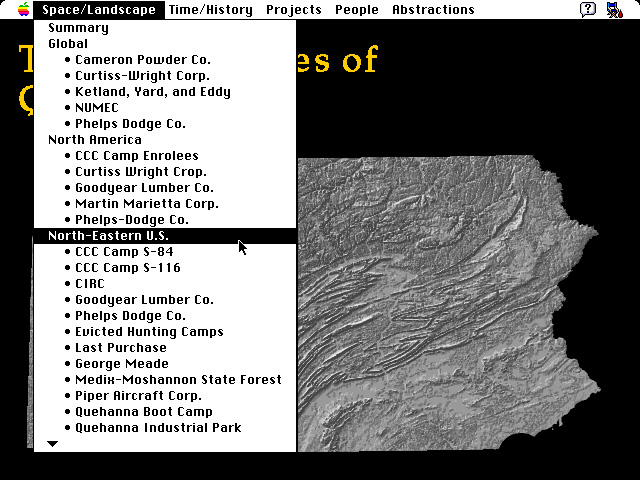
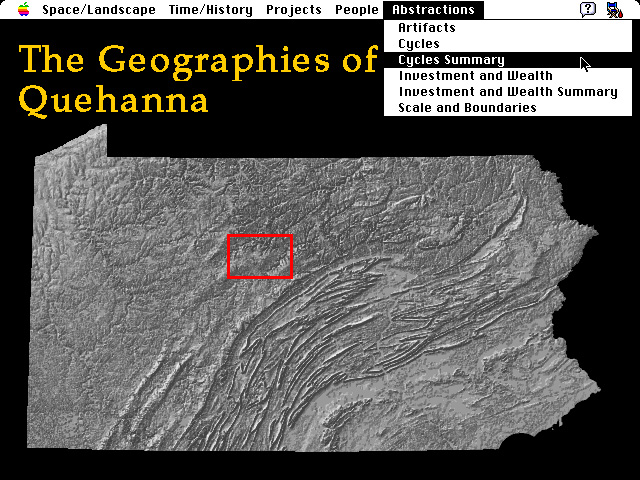
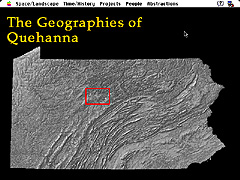
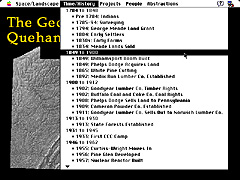
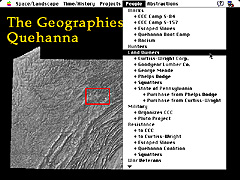
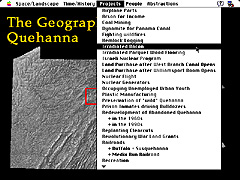
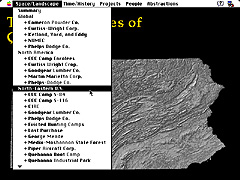
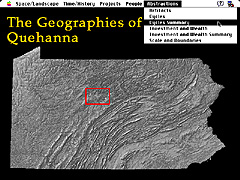
- Screen Shots: HyperQuehanna: interactively understanding landscape change
(social, historical, human) over time: Macromedia Director (ca 1988)
- Example: Newspaper Map (Flash)
- integrate maps, text, images, animations, etc. w/interactivity
Geographic Information Systems: GIS
- Not just making maps, but all the steps from collecting, processing and getting data
prepared, to analysis and interaction with the data (the latter in map form), to a final
map.
- Initially developed in the 1970s and 80s.
- GIS has layers of digital maps, linked to databases
- Basic GIS analysis: queries, buffers, finding what is near or inside, finding shortest
routes between two points, etc.
- Geography 355: Delaware Bike Trails Project
- Geography 355 Class Blog
- Rapid growth of GIS data infrastructure: Delaware County GIS
- Business applications: Wendy's & GIS
- GIS includes a broad range of software functions, in which maps play a central role,
with an ever-increasing array of applications and broadening user base.
Map Mashups:
- Mashup: putting different stuff together.
- Music mashups splice
and overlay segments of different songs that, in combination, become a new song.
- Map mashups combining geographic data and maps from multiple sources into a new map.
- Map Mashups require an API (Application programming interface): a bunch of programming tools
for building new applications.
- Google Maps API allows anyone to combine their data with Google Maps as
the background. Requires signing up for a free API key which allows you to create mashups with Google Maps, and
some HTML scripting). It also requires that you have geographic data, points, lines, and
areas, in latitude/longitude, and specify these locations in the HTML code. The benefit
is that anyone anywhere with web access can see your data mapped out with a Google Maps
background.
- Map Mashup Example:
The Geography of Geography 222 Spring 2009
- Google's My Maps
allows you to place points, lines, and areas directly on a Google Map
background, and annotate these features with text, images, and movies. Geography 222 exercise.
Now: Everything Together: Animation + Interactivity + Multimedia/Hypermedia + GIS + mashups all on the WWW
rapidly growing ease of access to technologies that have been accessible to only a few in the past.
Technological changes in mapping over the last 30 years more profound and fast
than in any other era in history.
Map concepts and map design: have not changed nearly as much but need to be adapted
to new technologies
This course: bring together more traditional cartography and cartographic design
with new technologies and new kinds of maps
- WWW mapping and GIS: everyone is a cartographer!
- everyone has to know the basics of making maps in this new context
Some general goals for this course:
Learn the logic and guidelines for making maps with computers
Learn the process of map making from beginning to end
Familiarize yourself with basic computer skills: working with Windows,
file management, graphic files, image processing software, HTML, WWW
searching, GIS software, Animation software, text processing, etc.
The Course in General
Your Instructor
Introduction to and Overview of Lab Project
- Lab project: your entire grade! (individual parts of project + evaluations)
- Multiple steps building up to a major project (vs. exercises)
- Missing classes, particularly when lab exercises are explained: don't do it
- Falling behind: fatal (loose points, difficult to catch up)
- Lab Computer Skills Required: on syllabus
- If you have particular skills (html, css, etc.) and want to do more than the basic
project - talk to me
- Grade based on how well your project reflects your abilities
- Grade based on creativity and working up to your ability
Basic Project: Visualizing Population Change, 1900 to 2010+
Goal: to produce a series of animated, interactive maps, for display on the WWW,
which serve as a means of visualizing county level population change over time.
- akin to a 'real world' project
I. Define the Geographic Context and Mapping Method
- Topic of US population change - animated
- Each student will chose a different state or group of states (Washington & Oregon, etc.) to focus on.
- Smaller states: do several (avoid Alaska, Hawaii and stupid states like Virginia)
- Gather additional information (historical, contemporary) about your state; helps
to interpret the patterns you see in animation
- Next time: Decide on your State(s)
- Techie overdose: Learn HTML, blogs, map mashups, FTP.
II. Locating, Downloading, and Processing Course Data
- Locate and Obtain US State Population Data 1900-2010
- In the real world: data not just given to you that is ready to use
- Potential problems and hassles: good!
- Processing the Data: editing, cleaning up, etc. w/ Excel Spreadsheet
III. Mapping the Data
- Create "choropleth" maps of the data: ArcGIS software
- link processed data to maps
- calculate % change; classify data and design maps
- document and evaluate
- additional map types created from same data
- Result: series of different maps in ArcGIS
IV. Animating the Series of Maps
- Using software to animate the series of maps
- Animation on the WWW: GIF file animation
- Animation in Google Earth: KMZ/KML file creation
V. Placing your materials on the Web - your already created pages
- By the end of the quarter [note: this is an historical artifact from 1999; I mean
semester, of course] you will have, on the WWW
- animated population change maps: Animated GIFs and KMZ files
- but also additional info about your project and links to additional info.
- WWW origins: sharing information among Scientists
- continue that tradition: share your work with rest of world (and
mom and pop and granny and gramps)
- if your project stinks, everyone (your mom, aunt, siblings, friends, reality TV
stars, etc.) will know.
- End of semester: present work in class
III. Some Final Comments...and things to start doing
- Attempt to have fun with the project and in the class
- encourage creativity, moving beyond the basic project
- use myself and other students as resources
- don't get lazy due to the different structure and approach to the course.
- Course evolving: Making Maps book and course revisions and changes in technology
- Technology = crisis: crashes, buggy software, lost files
- A learning process as much about computers as about mapping and GIS
- Document problems and triumphs
- Tradition of at least one student losing everything a few weeks from the end of the semester!
- You are responsible for backing up your work (flash drive, Google Drive)
- Positive outcome: increased comfort with computers and their quirks
OWU Geology & Geography Computer Lab
- regular hours: 7am-7pm M-F
- other hours: get code from instructor & use OWU card to get in building (maybe only doors on lower west side of building)
Basic rules and regulations in the Lab
- the Lab is for students enrolled in Geology/Geography courses and Geology/Geography/ES majors
- The Lab is for Mapping and GIS projects and other Geology/Geography projects
- The Lab has no full time attendant or technical staff
- Don't modify, add, or remove software: ask if you have software questions
- Projects will be discarded at end of semester (back up your work)
- Let me know, and place a note on the computer, if you notice a problem
- Food and drink policy: don't make a mess
- Relatively open and unrestrictive: don't do things which make me impose strict rules
Next meeting: initial lecture, contextualizing this course
- Choose a state(s) you are interested in and why
- Personal introductions
- Get used to using the WWW site! Go there and peruse the Syllabus and the Course Schedule
- Send me an email (jbkrygier@owu.edu) from
your OWU Email account and include the following information:
- Your Name (preferred name)
- This course (Geography 353)
- Major (if known)
- Year at OWU
- Hometown (and state or country)
- Computer Experience
- Other geography courses you have taken (name or number)
- Other geography courses you have this semester (name or number)
- Reason for taking this course
E-mail: jbkrygier@owu.edu
...to Geog 353 Main Page and Course Description
...to krygier teaching page.
...to krygier top page.
OWU Home
OWU
Geology and Geography Home